Collecting Feedback Is Not Enough: How to Turn Customer Feedback Into Insights
1,000 responses do not automatically give you 1,000 insights. Value emerges when the data helps you understand what keeps recurring, why it matters and what should happen next.
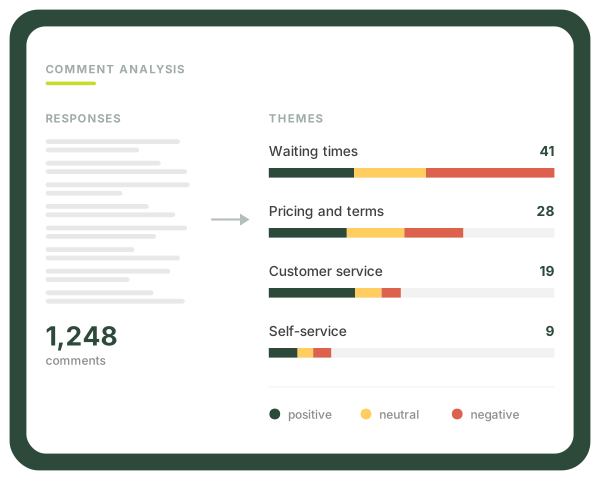
Collecting customer feedback is relatively easy today. You can send a survey after a purchase, place a QR code at a physical location, ask for feedback after a service interaction or track NPS, CSAT and other customer experience metrics over time. The bigger challenge begins once the responses start coming in.
Suppose overall satisfaction has declined. Is the cause longer waiting times, a new self-service journey, a problem at one location, a particular customer segment — or several things at once? A single score cannot tell you that. A few hundred open-ended comments might contain the answer, but only if you can organise and interpret them systematically.
That is why the value of customer feedback does not end with collection. The real work is turning responses into information that can be understood, compared, prioritised and used to make decisions.
Collect → structure → analyse → understand → act
If the process stops at “we collected the responses”, the organisation has data — but not necessarily insights.
On this page:
- We collected the responses. What next?
- One average can hide several very different stories
- The score shows the signal. The comment often explains the cause.
- When you have thousands of comments, reading them all is no longer analysis
- The most frequently mentioned issue should not always come first
- An insight needs to reach the person who can act on it
- Analysis does not end with a decision — you need to check whether the change worked
- Where does Apklausa360 help?
- From responses to decisions
- Sources
We collected the responses. What next?
A large feedback database has no value on its own. Even a well-designed survey can end up as an Excel file that gets opened once a quarter, skimmed and closed again. In that case, the organisation knows that it asked customers for feedback, but it does not necessarily know what it learned from them.
Research by Caemmerer and Wilson on customer feedback systems found that service improvement depends not only on how feedback is collected, but also on how it is interpreted and used across different levels of the organisation. The authors emphasise the need for better integration of feedback initiatives and for organisations to help people not only access customer data, but also interpret it and use it in decision-making. Source
“Effort needs to focus on interpreting and using the data collected.”
Adapted from Caemmerer & Wilson (2010).
The distinction is simple but important. A survey response is data. An insight emerges when you understand what that response means in a broader context — and whether it should influence what you do next.
One average can hide several very different stories
An overall customer satisfaction score can look perfectly stable while masking very different customer experiences underneath. This is particularly relevant for organisations with multiple locations, service channels, products or customer segments.
Suppose your overall CSAT is 82%. At first glance, that looks like one clear result. But once you segment the responses, you may find that satisfaction is 92% at one location, 84% at another and just 68% at a third. The overall average was technically correct. It simply failed to show where the actual problem was.
| Segment | CSAT |
|---|---|
| Overall result | 82% |
| Location A | 92% |
| Location B | 84% |
| Location C | 68% |
The same principle applies when comparing time periods, channels, products, new and long-term customers, or any other meaningful segment. Analysis lets you move from “our score is 82%” to much more useful questions: where is the score lower? For whom? When? And what changed?
An overall metric shows the direction. Segmentation shows you where to look for the cause.
The score shows the signal. The comment often explains the cause.
Quantitative metrics are useful because they make change easy to spot. NPS has fallen. CSAT is lower at one location. CES worsened after a new process was introduced. Those are important signals, but on their own they rarely explain what caused the change.
Open-ended comments add something that a 1-to-10 scale cannot: context. A customer can explain that the new checkout flow was confusing, that key information was missing during registration, that an employee helped resolve an otherwise frustrating issue, or that a specific feature became the main reason they rated the service more positively.
That is why customer feedback analysis increasingly combines quantitative and textual data. Marcolin and colleagues demonstrated how text classification, sentiment analysis and topic modelling can help managers in the hospitality sector extract decision-relevant information from customer reviews. Source More recent research by Kyriakidis and Tsafarakis also showed that combining textual and numerical review data can help identify the factors driving customer satisfaction and highlight areas that need improvement. Source
A score helps you see that something changed. A comment helps you understand why.
When you have thousands of comments, reading them all is no longer analysis
If you have twenty or fifty open-ended responses, reading them manually is manageable. Once the volume grows into the hundreds or thousands, that approach becomes slow, difficult to repeat consistently and highly dependent on the person doing the reading.
There is also a natural human tendency to remember vivid or emotional comments more strongly. One extremely angry response can feel more important than ten calmly worded comments describing the same recurring issue. With larger datasets, it is therefore not enough to simply read the comments. You need to analyse themes, frequency, sentiment and differences between customer groups systematically.
Text analysis methods can help by grouping similar topics, identifying recurring issues, analysing sentiment and connecting open-ended responses with other survey data. They do not remove the need for human judgement. They reduce the manual workload and make it easier to see patterns across large volumes of feedback.
AI can help structure large volumes of customer comments. The organisation still decides what to do with the resulting insights.
The most frequently mentioned issue should not always come first
Good analysis should not end with a list of “most frequently mentioned topics”. You also need to understand how much each issue actually matters to the customer experience and to the business.
A minor complaint about interior colours, for example, may appear frequently while having little effect on the overall experience. A less common problem in the payment flow, on the other hand, may cause customers to abandon their purchase altogether. Simply counting comments does not distinguish between these two situations.
| What should you evaluate? | Why does it matter? |
|---|---|
| Frequency | Is the issue recurring across many customers? |
| Sentiment / severity | Does the feedback describe a minor inconvenience or strong dissatisfaction? |
| Affected group | Does the problem affect everyone, or only a specific location, service or segment? |
| Impact on the experience | Is the issue related to overall satisfaction, loyalty or a critical point in the customer journey? |
| Ability to act | Can the organisation realistically address it, and is there a clear owner? |
Research by Kim, Maeng and Ryu highlights this point directly: identifying what customers are talking about is not enough. Their proposed framework connects key themes with specific customer actions and helps prioritise areas for improvement. In other words, analysis should not only answer “What are customers talking about?” It should also help answer “Where should we act first?” Source
An insight needs to reach the person who can act on it
Even excellent analysis loses value if the findings remain buried in one person's report. The customer support team may see one set of recurring issues, the product team another, while location managers may never see the themes appearing in customer comments at all.
Birch-Jensen, Gremyr and Halldorsson, in their research on the systematic use of customer-initiated feedback for service improvement, identified three important stages: getting feedback into the organisation, processing it and turning it into knowledge that can be used across different functions. In other words, the process should not stop with the survey or CX team. The information needs to reach the people who can actually change the product, service or process. Source
Collect → process → turn into organisational knowledge → assign action
Research by Zand and colleagues on customer knowledge management reinforces the same idea. Their findings suggest that stronger organisational performance is linked not simply to having infrastructure or large volumes of customer data, but to the organisation's ability to process customer knowledge and turn it into organisational capability. Put simply, having customer information and knowing how to use it are two different things. Source
Having customer data ≠ knowing how to learn from it.
Analysis does not end with a decision — you need to check whether the change worked
Customer feedback is most valuable when it becomes a cycle rather than a one-off project. The organisation identifies a problem, makes a decision, implements a change and then measures again to determine whether the customer experience actually improved.
Feedback → analysis → decision → change → measure again
Suppose customers consistently complain about long waiting times. You may change the process or adjust staffing. But only by measuring the experience again can you tell whether the issue has actually improved — or whether the friction has simply moved elsewhere in the customer journey. In this way, customer feedback becomes more than a report on the past. It becomes part of a continuous improvement process.
Why collect customer feedback in the first place?
Learn why customer feedback matters for customer experience, decision-making and business performance.
Where does Apklausa360 help?
When feedback is collected across multiple locations, at different points in time and from different customer groups, a simple response table quickly stops being enough. You need to see not only the overall result, but also the context behind it.
Apklausa360 lets you analyse quantitative survey results in one place, compare responses across locations, customer segments and other relevant dimensions, and analyse open-ended customer comments alongside the numbers. For larger volumes of text responses, AI-powered analysis can help identify recurring themes and sentiment.
That does not mean AI decides what your organisation should change. Its role is to structure large volumes of information more efficiently, so the people making decisions can see the bigger picture more clearly.
The goal is not to have more data. The goal is to understand what the data means — faster.
NPS, CSAT or CES: which metric should you use?
Learn how the main customer feedback metrics differ, what each one is designed to measure and when each can be useful.
From responses to decisions
Customer feedback can be an extremely valuable source of information, but collecting it does not guarantee that an organisation will learn anything from it. You need to separate signal from noise, compare different customer experiences, understand the reasons behind the numbers and make sure the most important insights reach the people who can act on them.
A good feedback system should therefore answer more than just “What did customers tell us?” It should also help answer: what keeps recurring? Where is the problem most severe? Which customers are most affected? What should we address first? And did the change we made actually work?
Collecting customer feedback is only the beginning. Its value emerges when responses become clear, actionable insights that support better decisions.
Sources
| Source | How it is used in this article | Link |
|---|---|---|
| Caemmerer, B. & Wilson, A. M. (2010). Customer feedback mechanisms and organisational learning in service operations. International Journal of Operations & Production Management, 30(3), 288–311. | Why feedback only creates value when it is interpreted, used and integrated into organisational decision-making. | View the study |
| Birch-Jensen, A., Gremyr, I. & Halldorsson, A. (2020). Digitally connected services: Improvements through customer-initiated feedback. European Management Journal, 38(5), 814–825. | How feedback moves from collection to processing and becomes knowledge that can be used across the organisation. | View the study |
| Zand, J. D., Keramati, A., Shakouri, F. & Noori, H. (2018). Assessing the impact of customer knowledge management on organizational performance. Knowledge and Process Management, 25(4), 268–278. | The difference between having customer data and having the organisational capability to turn it into usable knowledge. | View the study |
| Marcolin, C. B., Becker, J. L., Wild, F., Behr, A. & Schiavi, G. S. (2021). Listening to the voice of the guest: A framework to improve decision-making processes with text data. International Journal of Hospitality Management, 94, 102853. | How text analysis, sentiment analysis and topic identification can support better decision-making. | View the study |
| Kyriakidis, A. & Tsafarakis, S. (2025). Extracting knowledge from customer reviews: an integrated framework for digital platform analytics. International Transactions in Operational Research, 32(4), 2061–2086. | How numerical and textual review data can be combined to extract actionable insights. | View the study |
| Kim, M., Maeng, K. & Ryu, D.-H. (2026). Integrating customer actions into aspect-based service quality evaluation: A text mining framework. Journal of Retailing and Consumer Services, 90, 104692. | Why analysis should not only identify themes, but also help prioritise specific areas for improvement. | View the study |
Why collect customer feedback?
What customer feedback can reveal that operational metrics cannot, when negative feedback can become the most valuable signal, and how customer insight can translate into business value.
NPS, CSAT or CES: which customer feedback metric should you use?
There is no single best metric. Learn how NPS, CSAT and CES differ, when each one is useful and why their value can vary across industries.