NPS, CSAT or CES: Which Customer Feedback Metric Should You Use?
There is no single best customer feedback metric. The right choice starts with a simple question: what exactly are you trying to understand about your customers?
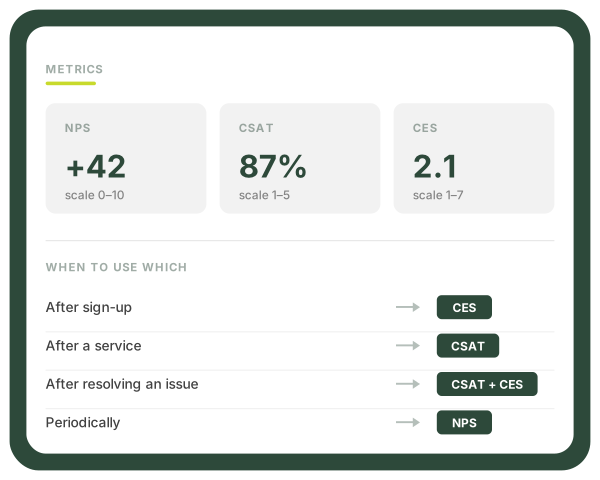
Customer experience can be measured in many different ways. Some organisations track NPS, others ask customers for a CSAT rating after each visit, while others use CES to understand customer effort. Some try to reduce the entire customer relationship to a single headline number.
The problem is that NPS, CSAT and CES are not simply three different names for the same thing. They look at customer experience from different angles. In academic research, these are often referred to as customer feedback metrics (CFMs), and studies show quite clearly that their usefulness depends on what you are trying to predict, what you are comparing and the industry in which you operate.
The best metric is not necessarily the one everyone else uses. It is the one that helps answer the question you are trying to solve.
On this page:
- The quick answer: which metric should you use?
- CSAT: when you want to evaluate a specific experience
- Top-2 Box: a different way to interpret responses
- NPS: useful, but not a single number for everything
- CES: when the key question is not “Did you like it?” but “Was it easy?”
- Do different industries need different metrics?
- In practice: what should you measure in different situations?
- Should you simply measure everything?
- The metric tells you what. The comment often tells you why.
- Sources
The quick answer: which metric should you use?
| What do you want to understand? | Metric | When it is particularly useful |
|---|---|---|
| Was the customer satisfied with a specific experience? | CSAT | After a purchase, visit, consultation or service interaction |
| Would the customer recommend the organisation? | NPS | When evaluating the broader, longer-term customer relationship |
| Was it easy for the customer to achieve their goal? | CES | Self-service, sign-up, support and returns |
| What proportion of customers are clearly satisfied? | Top-2 Box | When you want to see the share of strongly positive responses rather than an average |
| Why did the customer give that rating? | Open-ended question | Alongside any metric when you need to understand the reason behind the score |
CSAT: when you want to evaluate a specific experience
CSAT, or Customer Satisfaction Score, is one of the most versatile ways to quickly evaluate a specific customer experience. It is particularly useful when there is a clear connection between the customer interaction and the question being asked — for example after a restaurant visit, delivery, consultation, issue resolution or visit to a physical location.
In these situations, the customer is not evaluating an abstract relationship with the brand. They are rating a recent, clearly defined experience. That makes CSAT particularly useful for comparing performance across locations, services, time periods, channels or any other dimension that matters to the organisation.
CSAT is most useful when you want to answer: “Was the customer satisfied with what just happened?”
Research by Morgan and Rego found that average customer satisfaction measures had the strongest predictive value for future business performance among the customer feedback metrics they compared. Source More recent research by Agag and colleagues also identified overall satisfaction and Top-2 Box among the strongest-performing measures, although their effectiveness varied by industry and level of analysis. Source
Top-2 Box: a different way to interpret responses
Top-2 Box can sound like another standalone customer experience metric, but in most cases it is simply a different way of interpreting a satisfaction scale. For example, if customers rate their experience from 1 to 5, you can calculate not only the average score, but also the percentage of respondents who selected one of the two highest ratings — 4 or 5.
Why can this be useful? An average can sometimes smooth over meaningful differences. Top-2 Box gives you a clearer view of the proportion of customers who rated their experience positively. In research by de Haan, Verhoef and Wiesel, Top-2 Box satisfaction was, overall, the strongest predictor of customer retention. However, the authors also stressed that the best-performing metric varied across industries and depended on whether the analysis compared individual customers or companies. Source
Sometimes the important question is not only what you asked, but how you interpret the answers.
NPS: useful, but not a single number for everything
NPS measures a customer's willingness to recommend an organisation to others. For that reason, it is generally better suited to evaluating the broader customer relationship than a single, isolated transaction. For businesses built around an ongoing customer relationship — such as telecommunications providers, banks, gyms or subscription services — NPS can provide a convenient way to monitor overall customer sentiment over time.
Its popularity, however, can create the impression that NPS should be the primary, or even the only, customer experience KPI. Research does not support such a universal conclusion. In Morgan and Rego's analysis, recommendation-intention metrics had limited or no predictive value for some future business outcomes when compared with satisfaction measures. Source
Keiningham and colleagues separately tested the claim that Net Promoter was clearly superior to other metrics in predicting company growth and did not replicate such a clear advantage. That does not make NPS a poor metric. It simply means that NPS should not be treated as a universal answer to every customer experience question. Source
Popular does not mean universal. NPS can be useful without being the right metric for every situation.
CES: when the key question is not “Did you like it?” but “Was it easy?”
A customer can ultimately be satisfied with the outcome even if getting there required far more effort than it should have. Their problem was solved, but only after several phone calls. The order went through, but the checkout process was confusing. They managed to return the product, but only after spending too long trying to work out how.
In situations like these, CSAT and CES answer different questions. CSAT tells you how the customer evaluated the experience or outcome. CES, or Customer Effort Score, helps you understand how much effort the customer had to put in to achieve their goal.
CES can be especially useful for:
- registration and onboarding;
- self-service journeys;
- ordering and checkout;
- product returns;
- customer support and issue resolution.
The logic behind CES is intuitive: generally, the less effort required from the customer, the better. But context still matters. Research by Ardelet and Benavent found that greater customer effort was generally associated with lower satisfaction, while the relationship varied depending on the interaction channel and business sector. In other words, CES should not be interpreted in isolation. It is most useful when considered alongside the task the customer was trying to complete and the context in which the interaction took place. Source
Do different industries need different metrics?
Research suggests that there is no single metric that consistently outperforms all others across every industry. Agag and colleagues compared the relationship between different customer feedback metrics and firm performance and found that the strongest-performing metric varied by sector.
| Industry | Best-performing metric in the study | What this suggests |
|---|---|---|
| Online booking, hotels and e-commerce | Top-2 Box | In these sectors, the share of clearly positive satisfaction ratings was more informative when comparing companies. |
| Electronics and fixed-line telecommunications | Overall satisfaction | A conventional satisfaction measure performed strongest, suggesting that a more complex metric does not necessarily add more value. |
| Restaurants | CES | Customer effort and ease of the process showed the strongest relationship with firm performance in this sector. |
| Holiday parks | NPS | In this experience-led sector, the recommendation metric performed strongest. |
| All industries combined | No single winner | The broader conclusion is that metric performance depends on the industry, level of analysis and question being asked. |
These findings should not be turned into a rigid rule such as “restaurant = CES” or “hotel = Top-2 Box”. The more useful conclusion is that the same metric can have different value in different contexts. That is why customer feedback metrics should not be selected purely on the basis of what is most popular in the market. They should also reflect the specific customer journey and the business decision the data is meant to support.
In practice: what should you measure in different situations?
Industry alone is not enough to determine the right metric. The same restaurant may want to evaluate food quality, the ordering experience, delivery or long-term loyalty — and each of those questions may require a different measure. Still, the following can serve as a practical starting point:
| Situation / industry | Where to start | Why |
|---|---|---|
| Restaurant / food delivery | CSAT + CES + comment | Use CSAT for the specific experience, CES for friction in ordering, waiting or delivery, and an open-ended comment to understand the reason behind the score. |
| Hotels / travel | CSAT / Top-2 Box + NPS | The quality of a specific stay and the customer's broader willingness to recommend are different dimensions of the experience. |
| E-commerce | CSAT + CES | Measure satisfaction with delivery separately from the ease of checkout, returns or self-service. |
| Banking / financial services | NPS + CSAT + CES | The long-term relationship, individual service interactions and complex processes are different measurement objects. |
| Gyms / memberships | NPS + CSAT | NPS can track the broader relationship, while CSAT can evaluate specific services, locations or visits. |
| Telecommunications | NPS + CSAT + CES | Different metrics can be useful for the overall relationship, support and self-service journeys. |
| B2B / SaaS | NPS + CSAT + CES | The overall account relationship, onboarding, support and product usage should not necessarily be measured in the same way. |
Note: this table is intended as a practical starting point, not a universal research-backed rule for every organisation in each industry.
Should you simply measure everything?
Not necessarily. If every customer interaction is followed by NPS, CSAT, CES, ten additional ratings and five open-ended questions, you may generate a large amount of data in theory. In practice, you may simply create survey fatigue and reduce response rates.
A better approach is to break the customer journey into meaningful measurement points and ask a question with a clear purpose at each stage:
| Customer journey touchpoint | Metric and question |
|---|---|
| After registration | CES – Was the process easy? |
| After receiving a service | CSAT – Was the customer satisfied? |
| After issue resolution | CSAT + CES – Was the issue resolved satisfactorily, and was the process easy? |
| Periodically | NPS – Would the customer recommend the organisation? |
Research by de Haan and colleagues supports this broader approach. Combining multiple customer feedback metrics and measuring different dimensions of the customer relationship improved the prediction of customer retention. In other words, a small set of purposeful metrics can often be more useful than trying to find one supposedly “perfect” number. Source
The metric tells you what. The comment often tells you why.
NPS has fallen. CSAT is lower at one location than at others. CES worsened after a new self-service journey was introduced. These are valuable signals, but they do not explain the cause.
That is why it is often worth giving customers the opportunity to briefly explain their rating alongside the core metric. A simple open-ended question such as “What was the main reason for your rating?” can provide context that a number alone never will.
A score helps you spot the change. A comment helps you understand what is behind it.
This is where the next stage of customer feedback begins: connecting NPS, CSAT or CES with open-ended comments, recurring themes, locations and specific business processes.
Why is collecting customer feedback alone not enough?
Learn how to analyse and interpret customer feedback and turn individual responses into insights your organisation can actually use.
One dashboard does not have to mean one metric
Apklausa360 allows organisations to use different customer feedback metrics within the same system depending on what they want to understand. You can track CSAT after a specific service interaction, use CES to measure the ease of a process, and measure NPS periodically to monitor the broader customer relationship.
Results can be compared across locations, customer groups, time periods or other dimensions relevant to the organisation. Quantitative metrics can also be analysed alongside open-ended customer comments. This makes it possible not only to see that a result has changed, but also to investigate why it changed.
Customer experience is not a single number. Its measurement should not be forced into a single metric either.
Why collect customer feedback in the first place?
Learn how customer feedback supports better decision-making, helps organisations understand the customer experience and can contribute to better business outcomes.
Sources
| Source | Link |
|---|---|
| Agag, G. et al. (2023). Understanding the link between customer feedback metrics and firm performance. Journal of Retailing and Consumer Services, 73, 103301. | View the study |
| de Haan, E., Verhoef, P. C. & Wiesel, T. (2015). The predictive ability of different customer feedback metrics for retention. International Journal of Research in Marketing, 32(2), 195–206. | View the study |
| Morgan, N. A. & Rego, L. L. (2006). The Value of Different Customer Satisfaction and Loyalty Metrics in Predicting Business Performance. Marketing Science, 25(5), 426–439. | View the study |
| Keiningham, T. L., Cooil, B., Andreassen, T. W. & Aksoy, L. (2007). A Longitudinal Examination of Net Promoter and Firm Revenue Growth. Journal of Marketing, 71(3), 39–51. | View the study |
| Ardelet, C. & Benavent, C. (2023). Does making less effort entail satisfaction? A large empirical study on client relationship services. International Journal of Market Research, 65(1), 83–99. | View the study |
Why Collect Customer Feedback?
Learn what customer feedback can reveal that operational metrics cannot, when negative feedback can become the most valuable signal, and how customer insight can translate into business value.
Collecting Feedback Is Not Enough: How to Turn Customer Feedback Into Insights
Learn how to move from individual responses to recurring themes, root causes and priorities — and why a single average can hide several very different customer experiences.
CSAT: What It Is and How to Calculate Customer Satisfaction Score
The CSAT formula, a calculation example, how to choose a response scale and how CSAT differs from NPS and CES.
NPS: What It Is, How to Calculate It and How to Interpret the Score
Learn what Net Promoter Score is, how it is calculated using the percentage of Promoters and Detractors, and how to interpret the result.