NPS: What It Is, How to Calculate It and How to Interpret the Score
NPS (Net Promoter Score) is a customer loyalty metric that measures how likely customers are to recommend your company, product or service. It is calculated by subtracting the percentage of detractors from the percentage of promoters, producing a score from –100 to +100.
Detractors
Dissatisfied or disappointed customers who are unlikely to recommend the organisation.
Passives
Satisfied but not particularly loyal customers who may still be tempted by competitors.
Promoters
Loyal customers who are highly likely to recommend the organisation to others.
NPS = % Promoters – % Detractors
What is NPS?
What does Net Promoter Score mean?
NPS stands for Net Promoter Score. It is one of the most widely used customer loyalty metrics worldwide and is based on a single question: how likely is a customer to recommend an organisation to someone else?
It is important to understand that NPS measures loyalty, not simply satisfaction. A customer may be satisfied with a particular purchase without feeling strongly enough about the organisation to recommend it.
Recommendation intent matters for two reasons: loyal customers are often more likely to stay longer and continue buying, while positive word of mouth can also help attract new customers without additional acquisition spend.
Because the NPS question uses a standardised format and a consistent 0–10 scale, it can be measured repeatedly to track how the customer relationship changes over time.
At the same time, NPS should not be treated as an absolute “customer experience score”. It is one component of customer experience measurement and is most useful when combined with other metrics and open-ended customer feedback.
What does NPS actually tell you?
When used correctly, NPS can help you understand:
- customer loyalty – what proportion of customers feel strongly connected to the organisation;
- likelihood to recommend – whether customers are likely to advocate for the organisation or share negative experiences;
- strength of the customer relationship – how likely customers are to stay and choose the organisation again;
- changes in customer experience over time – whether customer sentiment improves or deteriorates after changes are introduced;
- differences between customer segments – how ratings vary between customer groups, business units or service channels.
It is equally important to understand what the NPS score does not tell you. It does not explain why customers chose a particular rating.
A declining NPS may be caused by service quality, pricing changes, competitor offers, technical issues or something else entirely. The score alone does not identify the cause. That is why an NPS survey should usually include an open-ended follow-up question asking customers to explain the reason for their rating.
How is NPS calculated?
The NPS methodology is simple and standardised. This makes it possible to compare results across time periods, business units or survey waves.
Every respondent is classified into one of three groups based on their 0–10 rating, and the final score is calculated using two of those groups.
Promoters, Passives and Detractors
| Rating | Group | Meaning |
|---|---|---|
| 9–10 | Promoters | Loyal customers who are highly likely to recommend |
| 7–8 | Passives | Satisfied but not particularly loyal customers |
| 0–6 | Detractors | Dissatisfied or disappointed customers |
Passives are one of the most common sources of confusion when calculating NPS. Three points are worth remembering:
- Passives are not directly included in the formula — their percentage is neither added nor subtracted;
- they are included in the total number of respondents used to calculate the percentages of Promoters and Detractors;
- NPS is not an average rating — it is the difference between the percentage of two respondent groups.
NPS formula
NPS = % Promoters – % Detractors
NPS = (% of respondents who selected 9–10) – (% of respondents who selected 0–6)
The score can range from –100, where every respondent is a Detractor, to +100, where every respondent is a Promoter.
NPS is normally reported as a whole number without a percentage sign.
NPS calculation example
Suppose 200 customers respond to an NPS survey:
- 110 select 9 or 10;
- 50 select 7 or 8;
- 40 select a score from 0 to 6.
The calculation is:
- Promoters: 110 / 200 = 55%;
- Detractors: 40 / 200 = 20%;
- NPS: 55% – 20% = 35.
The organisation's NPS is therefore +35.
Passives are neither added nor subtracted when calculating the final score, but they remain part of the total respondent base. Without them, the percentages of Promoters and Detractors would be different.
Common NPS calculation mistakes
The most common mistakes when calculating and reporting NPS include:
- calculating the average rating – the average score on the 0–10 scale is not NPS and should not be compared with other organisations' NPS results;
- including Passives in the formula – adding or subtracting the percentage of Passives distorts the result;
- ignoring small sample sizes – NPS based on only a handful of responses can move by dozens of points due to random variation alone;
- comparing non-comparable periods or segments – for example, comparing peak season with a quiet period, or new customers with long-standing customers;
- reporting the score without the number of responses – an NPS of +60 based on 10 responses and an NPS of +60 based on 1,000 responses do not carry the same level of confidence.
NPS calculation can be automated
Apklausa360 automatically classifies respondents as Promoters, Passives or Detractors, calculates NPS and lets you track changes in the score over time.
What is a good NPS score?
How should you interpret NPS?
The simplest rule is this: a positive NPS means you have more Promoters than Detractors, while a negative NPS means Detractors outnumber Promoters.
The table below provides a rough reference point, but it should be treated as directional rather than universal. The same score can mean very different things across industries.
| NPS score | Indicative interpretation |
|---|---|
| Below 0 | More Detractors than Promoters |
| 0–30 | Positive, but with significant room to improve |
| 30–50 | A strong result in many industries |
| 50–70 | Very high customer loyalty |
| Above 70 | Exceptionally high result |
Why is there no universal benchmark for a “good” NPS?
There is no single NPS benchmark that applies equally to every organisation because results are affected by many factors outside the company's direct control:
- industry – average NPS in sectors such as telecommunications or insurance is often much lower than in more specialised service businesses;
- market and competitive environment – customers may rate differently in markets with limited alternatives;
- customer type – B2B and B2C respondents often use rating scales differently;
- length of the customer relationship – long-standing customers may evaluate the organisation differently from newly acquired customers;
- survey timing – a survey immediately after a successful purchase may produce different results from one sent after a price increase;
- survey channel – email, website and phone surveys can attract different respondent profiles;
- cultural response patterns – respondents in some countries are more likely to use extreme ratings, while others prefer the middle of the scale;
- type of product or service – emotionally significant services are often evaluated differently from routine purchases.
For these reasons, the most useful comparison is usually not against a universal benchmark, but against your own historical NPS trend and, where available, reliable benchmarks from your own industry.
The NPS trend matters more than a single score
A one-off NPS measurement only tells you where you are now. More value comes from tracking NPS consistently over time:
- monthly or quarterly trends show whether the customer relationship is improving or deteriorating;
- changes after major initiatives — such as a new product, service process or pricing change — help you assess whether the initiative had the intended effect;
- seasonality helps distinguish natural fluctuations from genuine problems;
- sample size determines whether changes between periods are meaningful;
- changes in respondent mix matter — if one quarter is dominated by new customers and the next by long-term customers, the scores may not be directly comparable.
Small movements should be interpreted carefully. A change of only a few NPS points with a small sample is often statistical noise rather than a genuine trend. Before drawing conclusions, check whether the change persists across multiple periods and whether it is also visible in specific segments.
How should you phrase the NPS question?
Standard NPS question
NPS is based on a standard question:
How likely are you to recommend [company, product or service] to a friend, colleague or someone else?
Response scale: 0 – Not at all likely, 10 – Extremely likely.
The item in square brackets should be chosen carefully because it determines what the score actually measures:
- the organisation – for the overall relationship and loyalty;
- a specific product – for product experience;
- a service – for evaluating a particular service;
- a service channel – such as a self-service portal or call centre;
- a specific touchpoint – such as delivery or implementation.
The object being measured should remain consistent. If you ask about the company in one quarter and the product in the next, the two results are no longer directly comparable.
What open-ended follow-up question should you ask?
The NPS score itself does not explain the reason behind the rating, so it is good practice to follow it with an open-ended question. A useful default is:
What is the main reason for your rating?
Depending on the purpose of the survey, other useful options include:
- “What could we change to earn a higher rating next time?”
- “What does our team do particularly well?”
- “What could we improve?”
Follow-up questions can also be tailored dynamically based on the NPS rating:
- Detractors – what went wrong and what would be an acceptable resolution;
- Passives – what is missing for them to give a higher score;
- Promoters – what creates the most value and should be preserved.
What should you avoid?
When designing an NPS survey, avoid several common mistakes:
- do not change the 0–10 scale – a 1–5 or 1–7 scale is no longer standard NPS and cannot be compared directly with conventional NPS results;
- do not combine several topics in one question – “Would you recommend our product and customer service?” makes it impossible to know what the respondent is rating;
- do not use leading wording – “How likely are you to recommend our excellent service?” introduces bias;
- do not add too many follow-up questions – long surveys reduce response rates and response quality; for NPS, the score and one or two open-ended questions are often enough;
- do not ask for recommendation intent too early – a customer who has barely used the service cannot make a well-informed judgement about whether they would recommend it.
When and how should you run an NPS survey?
Relationship NPS
Relationship NPS measures the customer's overall relationship with the organisation rather than tying the rating to a specific interaction. These surveys are usually sent at regular intervals:
- quarterly;
- every six months;
- annually;
- periodically to rotating customer samples so the same customer is not surveyed too often.
Relationship NPS is best suited to measuring overall loyalty, long-term customer experience, the strength of the relationship and sentiment among strategically important customer groups. It is typically the type of NPS that is most relevant at management level and can be linked to longer-term organisational goals.
Transactional NPS
Transactional NPS is triggered after a specific customer action or interaction, such as:
- a purchase;
- product delivery;
- a customer service interaction;
- a consultation;
- resolution of an issue;
- registration or onboarding.
Transactional NPS helps connect the score to a specific part of the customer journey and can reveal where friction occurs.
However, for very specific interactions, another metric may sometimes be more appropriate: CSAT is often better for measuring satisfaction with a particular interaction, while CES is designed to measure how easy or difficult a process was.
When should you send an NPS survey?
The right timing depends on the use case:
- after service delivery – once the customer has experienced the full service rather than just the beginning;
- after issue resolution – once the customer has received the final outcome, not immediately after first contacting support;
- for relationship NPS – on a regular and comparable schedule;
- for B2B customers – aligned with the contract or usage cycle, for example after implementation or before renewal;
- for new customers – only after they have had enough experience with the product or service to form a meaningful opinion.
How often should you survey the same customer?
Even a well-designed survey loses value if customers receive it too frequently. An NPS programme should account for:
- survey fatigue – the more often customers are surveyed, the more likely response rates and response quality are to decline;
- contact frequency limits – define how often the same customer can receive survey invitations within a given period;
- sampling – recurring relationship surveys can be sent to a sample rather than the entire customer base;
- tracking the last survey invitation – a customer who has just completed a transactional survey should not immediately receive a relationship NPS survey;
- coordinating different survey programmes – NPS, CSAT and other surveys should be planned together rather than independently.
Reach customers with NPS surveys at the right moment
Apklausa360 lets you trigger NPS surveys at different points in the customer journey — after a purchase, service interaction or consultation — and distribute them by email, on your website or through integrations with other systems.
How should you segment and analyse NPS results?
Why is overall NPS not enough?
An organisation-wide NPS gives you an average view that can hide the differences that matter most. It may conceal:
- an underperforming branch whose low scores are offset by stronger locations;
- a specific channel — such as self-service — that performs much worse than assisted service;
- a dissatisfied customer segment whose responses disappear in the overall average;
- regional differences between cities or branches;
- product-specific issues that are invisible in the overall score;
- differences between new and long-standing customers.
An organisation that looks only at the headline NPS often discovers these problems too late — once they are already affecting revenue or customer retention.
How should you segment NPS?
The most useful cuts depend on the organisation and its operating model, but NPS is commonly analysed by:
- business unit;
- physical location;
- region;
- service channel;
- product;
- customer type;
- subscription or contract plan;
- customer age or relationship tenure;
- responsible team;
- survey trigger or timing.
One condition is critical: every segment needs a sufficient number of responses. An NPS based on five responses tells you very little about a branch or segment. In such cases, it is better to combine smaller segments or accumulate responses over a longer period.
How should you analyse changes in NPS over time?
A practical approach is:
- Track the overall NPS and its direction.
- Compare the main customer segments.
- Identify where the change occurred — overall movement is often driven by a single branch, customer group or channel.
- Review open-ended comments from that segment to understand the likely causes.
- Connect the change to operational or business events — such as pricing, process, staffing or system changes.
- Check whether the movement continues in the next period — a one-off fluctuation is not yet a trend.
How should you analyse open-ended NPS comments?
Why are comments more useful than the score alone?
NPS tells you what is happening. Comments help explain why. When analysed systematically, open-ended responses can reveal:
- recurring themes behind low or high ratings;
- specific problems that can be routed to the relevant teams;
- the language customers use, which can also be valuable for communication and messaging;
- differences between the reasons given by Promoters and Detractors;
- early signals of emerging issues before they become visible in the headline score.
Categorising NPS comments
To avoid turning open-ended feedback into an unmanageable list of text, comments can be grouped into categories. Common themes might include:
- service quality;
- waiting time;
- product functionality;
- price;
- communication;
- delivery;
- issue resolution;
- staff competence.
The category framework should be adapted to your organisation and used consistently so you can track how the share of comments within each theme changes over time.
Sentiment analysis
Sentiment analysis classifies comments as positive, neutral or negative. But sentiment alone is not enough. Knowing that 30% of comments are negative does not tell you what action to take.
Sentiment becomes more useful when combined with:
- the topic – which areas attract the most negative feedback;
- the business unit or location – where problems are concentrated;
- the customer segment – which groups are most dissatisfied;
- the NPS category – what Detractors say versus Promoters;
- the time period – whether negative feedback is increasing or decreasing;
- previous results – whether the picture changes after actions have been implemented.
How should you prioritise issues?
You cannot solve every issue mentioned in customer comments at once. Prioritisation can consider:
- how frequently the issue appears;
- the proportion of negative comments within the topic;
- the number of customers affected;
- the relationship with NPS decline — whether the theme appears disproportionately in Detractor comments;
- business impact — including revenue, retention and service costs;
- whether the issue can realistically be addressed with available resources.
How do you turn NPS results into action?
NPS creates value only when the results change what the organisation does. A report that remains in a presentation deck does not improve the customer experience. In practice, a five-step cycle works well.
Follow up with Detractors
Close the feedback loop. Negative ratings should automatically reach the responsible employee or team, the customer's situation should be reviewed, and where appropriate — and with the customer's consent — the customer should be contacted. The resolution should be recorded, while recurring root causes should be analysed separately.
Learn from Promoters
Promoter feedback highlights the strongest parts of the customer experience, high-performing teams and processes, customer language that may be useful in communication, and practices that can potentially be replicated elsewhere in the organisation.
Identify systemic issues
Distinguish between an individual incident, a problem limited to one branch and an issue recurring across the entire organisation. Also distinguish a short-term fluctuation from a sustained negative trend. The appropriate response depends on whether the issue requires a local fix or a broader systemic change.
Assign ownership and deadlines
Every action should have a clearly defined problem, owner, planned intervention, deadline, success criterion and date for follow-up measurement. Without ownership, insights remain observations.
Measure whether the actions worked
An NPS programme should not end when the report is produced. Return to the data and check whether the share of Detractors decreased, whether the affected segment improved, whether comments about the issue became less frequent and whether the improvement persisted into the next period.
How does Apklausa360 help you run and analyse NPS surveys?
Running an effective NPS programme requires more than asking the question and calculating an overall score. The value comes from continuously collecting feedback, tracking change, analysing different customer segments and routing relevant information to the teams that can act on it.
That is how Apklausa360 is designed to work: as an ongoing customer experience management platform rather than a tool for one-off surveys.
Create and distribute NPS surveys
The platform lets you create the standard 0–10 NPS question, add open-ended follow-ups and configure conditional questions based on the rating, so Detractors, Passives and Promoters can receive different follow-up questions. Surveys can reach customers through multiple channels:
- email with a unique survey link for each customer;
- your website;
- QR codes;
- API integrations with your systems;
- automated triggers after specific customer actions, such as a purchase, service interaction or case closure.
Automatic NPS calculation
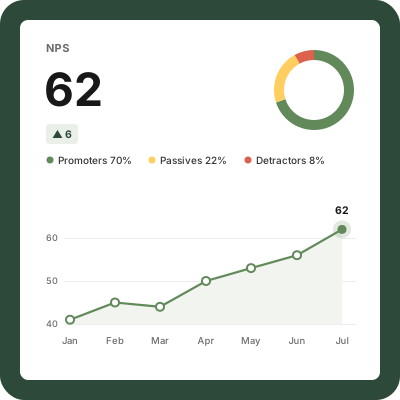
Respondents are automatically classified as Promoters, Passives or Detractors. The platform shows the overall NPS, number of responses, distribution across the three groups and comparisons between time periods.
There is no need to calculate averages manually, assign groups in spreadsheets or maintain separate calculation tables.
Track NPS by segment
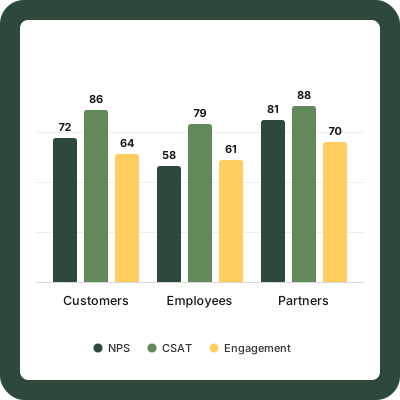
Results can be filtered by business unit, location, channel, product, customer segment, time period and other organisational data passed through integrations.
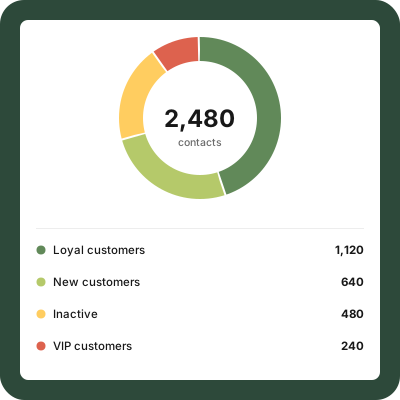
This breaks down the headline NPS into the segments where you can see where the experience is strongest and where problems are actually occurring.
Analyse open-ended responses
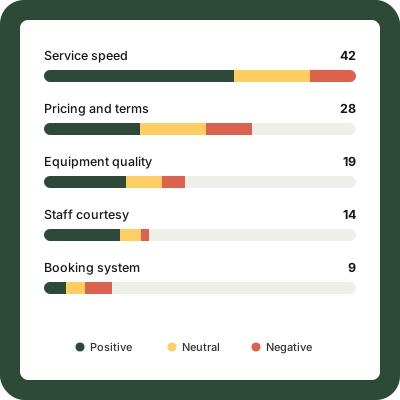
Open-ended NPS comments can be automatically categorised by theme, assigned sentiment and analysed for recurring topics and negative signals.
Comments can also be compared across segments and time periods, allowing you to see not only what customers are saying, but how the conversation changes over time.
Role-based dashboards and alerts
Different roles can see the information relevant to them. Executives can monitor headline metrics and trends, while operational teams can focus on their own business unit, location or individual customer responses.
Configurable alerts can notify teams about negative ratings or significant changes in the score, while dashboards can be used to track whether corrective actions have improved the result.
How is NPS different from CSAT and CES?
| Metric | What does it measure? | Typical question | When should you use it? |
|---|---|---|---|
| NPS | Loyalty and likelihood to recommend | Would you recommend us? | To measure the overall relationship and long-term customer experience |
| CSAT | Satisfaction with a specific experience | How satisfied are you? | After a specific service interaction or experience |
| CES | Customer effort | How easy was it to achieve your goal? | To evaluate processes, service interactions and self-service journeys |
When should you use NPS?
NPS is useful when you want to:
- assess the overall customer relationship rather than a single interaction;
- measure loyalty and likelihood to recommend;
- track long-term trends through regular measurement;
- compare different customer groups.
When is NPS not enough?
NPS alone is not enough when you need to understand:
- whether the customer was satisfied with a specific service interaction — CSAT is usually more appropriate;
- how much effort a process required from the customer — CES is designed for this;
- which specific part of the service performed poorly — this requires more detailed questions about individual aspects of the experience.
In practice, these metrics do not compete with one another. They complement each other. NPS tracks the broader relationship, while CSAT and CES measure specific interactions and processes. In an ongoing customer experience management programme, they are often used together.
Frequently asked questions about NPS
What is NPS?
NPS, or Net Promoter Score, is a customer loyalty metric that measures how likely customers are to recommend an organisation, product or service to others. Customers rate their likelihood to recommend on a 0–10 scale, and NPS is calculated by subtracting the percentage of Detractors from the percentage of Promoters. The result can range from –100 to +100.
How is NPS calculated?
NPS is calculated using the formula: % Promoters – % Detractors. Promoters are respondents who select 9 or 10. Detractors are those who select a score from 0 to 6. For example, if 55% of respondents are Promoters and 20% are Detractors, the organisation's NPS is +35.
What is a good NPS score?
A positive score means you have more Promoters than Detractors, which is already a favourable sign. In many industries, a score above 30 is considered strong and a score above 50 very high. However, the right benchmark depends on industry, market and customer type, so it is usually more meaningful to compare your NPS against your own historical trend and relevant sector benchmarks.
Are Passives included in the NPS calculation?
Passives, who select 7 or 8, are included in the total respondent base used to calculate the percentages of Promoters and Detractors. However, the percentage of Passives is neither added nor subtracted in the NPS formula itself. A large share of Passives therefore reduces the percentage share of both Promoters and Detractors.
What is the difference between NPS and CSAT?
NPS measures loyalty and the broader relationship with the organisation — whether the customer would recommend it. CSAT measures satisfaction with a specific experience, such as a purchase, service interaction or individual service. A customer may be satisfied with a particular interaction without being loyal to the organisation overall, which is why the two metrics complement each other.
How often should you run an NPS survey?
It depends on the type of NPS programme. Relationship NPS, which measures the overall customer relationship, is commonly run quarterly, every six months or annually. Transactional NPS is triggered continuously after specific events such as a purchase or service interaction. In both cases, contact frequency should be controlled so the same customer is not surveyed too often.
How many responses do you need for a reliable NPS result?
There is no universal minimum. Reliability depends on the size of the customer base, the sample, the level of precision required and whether you plan to break the results down into smaller segments. The general rule is simple: the fewer responses you have, the greater the random variation. NPS should therefore be reported alongside the number of responses, and small-segment results should be interpreted with caution.
Can you compare NPS between different companies?
At a high level, yes — but with caution. Different companies may use different survey timing, channels, sampling methods and objects of evaluation, while average NPS also varies significantly by industry. The most reliable comparison is usually your own NPS trend over time and benchmark data based on a comparable methodology within the same sector.
Why should you include an open-ended question with NPS?
Because the score does not explain the reason behind the rating. A follow-up such as “What is the main reason for your rating?” helps identify the specific factors driving high or low scores. That is what turns NPS from a number you monitor into feedback you can act on.
Can NPS be negative?
Yes. A negative NPS means the percentage of Detractors is higher than the percentage of Promoters. In that situation, the priority is to understand why: review Detractor comments, identify underperforming segments and track whether the situation improves after corrective actions are implemented.
NPS is a starting point, not the end result
NPS creates the most value when an organisation continuously collects customer feedback, analyses the reasons behind the score, routes insights to the teams responsible and measures the impact of the changes that follow.