Customer Experience Management That Turns Feedback Into Action
Collect feedback after purchases, service interactions and support experiences, track NPS, CSAT and CES, analyse results by business unit, channel and customer segment, and turn customer data into concrete actions across your organisation.
Not one survey a year, but an ongoing customer experience management system.
Data hosted in Europe
NPS, CSAT and CES
API and integrations
Custom dashboards
B2B implementation and support
Customer experience management is more than an annual survey
An annual customer satisfaction survey can give you a high-level view of the situation: how many customers are satisfied, how many would recommend your organisation and how this year's result compares with the previous year. But a one-off measurement often fails to answer the questions that drive day-to-day decisions:
- after which interaction did the customer experience deteriorate;
- which branch or channel is causing the problem;
- which customer segments experience the most friction;
- when did the metric start to change, and is the trend continuing;
- which specific factors have the greatest impact on the result;
- whether the situation actually improved after changes were implemented.
When a full year passes between measurements, organisations are often left guessing. Problems are identified too late, and the impact of corrective actions is never properly measured.
| One-off survey | Ongoing customer experience management |
|---|---|
| One measurement point | Continuous monitoring of change |
| One overall organisational result | Analysis by business unit and channel |
| A report after the survey | Continuously updated dashboards |
| Action taken months later | Faster identification of problems |
| Dependence on an external research provider | In-house access to ongoing analytics |
Customer experience management is a continuous process of measurement, analysis and action — not a standalone project carried out once a year.
From collecting feedback to taking action
In Apklausa360, customer experience management works as a continuous cycle: feedback is collected automatically, results are analysed in the context of your organisation, and insights are turned into actions whose impact can then be measured in the next cycle.
Define the right measurement points
Identify where in the customer journey feedback should be collected: after a purchase, after service delivery, after a support interaction or periodically to evaluate the overall customer relationship.
Collect responses automatically
Trigger surveys after specific events by email, on your website, via QR code, on a POS device or through another channel that fits the interaction. Each response retains its context — such as the order, business unit or customer segment.
Analyse the results
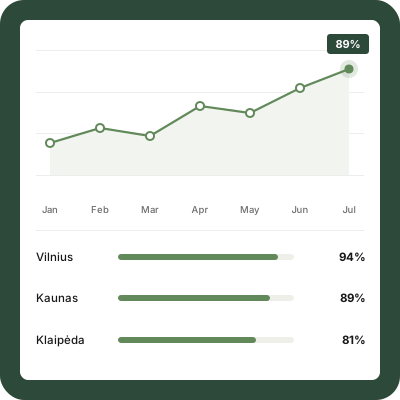
Filter data by business unit, location, channel, customer segment, time period and other parameters relevant to your organisation. Break the headline metric down into the dimensions where the real issues become visible.
Turn insights into action
Identify problem areas, trends and the main drivers of customer satisfaction, decide what to improve first and monitor whether the changes actually made a difference.
Collect feedback at the most important customer journey touchpoints
Customer experience is shaped by a sequence of interactions, not a single event. Apklausa360 lets you connect surveys to real customer actions and ask for feedback while the experience is still fresh:
- after a purchase;
- after product delivery;
- after service delivery;
- after a consultation;
- after a branch visit;
- after a customer service interaction;
- after training or an event;
- after an issue has been resolved;
- when a service is cancelled;
- periodically to assess the overall customer relationship.
You do not need to ask the same questions at every touchpoint. Different objectives call for different metrics, question sets and survey timing. A short post-delivery survey measures something very different from an annual relationship survey.
Relationship surveys
Relationship surveys assess the customer's overall relationship with the organisation, including trust, loyalty, intention to stay and likelihood to recommend.
- typically run periodically, for example quarterly or annually;
- most commonly use NPS;
- useful for measuring loyalty and the long-term customer relationship;
- show how the relationship changes over time.
Transactional surveys
Transactional surveys are triggered immediately after a specific interaction and evaluate an individual purchase, service or touchpoint.
- automatically triggered after an event;
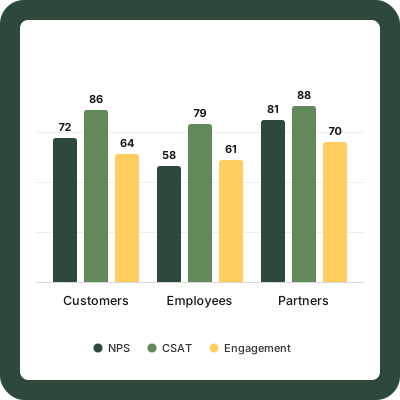
- commonly use CSAT and CES;
- help identify problems in specific processes quickly;
- results can be linked to a branch, channel or team.
Choose the right metric: NPS, CSAT or CES
Net Promoter Score
What it measures: customer loyalty and willingness to recommend your organisation.
When to use it: to assess the broader customer relationship in periodic relationship surveys.
Customer Satisfaction Score
What it measures: satisfaction with a specific service, product or interaction.
When to use it: after a purchase, support interaction, consultation or another transaction.
Customer Effort Score
What it measures: how much effort a customer had to make to achieve their goal.
When to use it: to evaluate registration, issue resolution, self-service or another process.
In addition to standard CX metrics, organisations can measure criteria specific to their own operations, such as service speed, employee professionalism, process clarity, product quality, adequacy of information or individual aspects of a service. Custom questions can be combined with standard metrics in the same survey, so you can see both the headline result and the factors driving it.
Automate survey delivery and response collection
Make feedback collection part of the process rather than a separate task someone has to remember every month:
- trigger surveys after a specific event;
- generate unique survey links for each customer;
- connect your systems through API and SDK integrations;
- send emails through Apklausa360 infrastructure;
- track email delivery and open rates;
- monitor started but incomplete surveys;
- collect responses via QR codes, websites, POS devices or tablets;
- use different channels for different touchpoints.
What does this look like in practice?
An order is marked as delivered. The customer automatically receives an email with a unique survey link. Their response is linked to the order type, customer segment and delivery region. The results appear automatically in the relevant dashboard — no exporting, manual data entry or data transfer required.
Analyse results the way your organisation actually operates
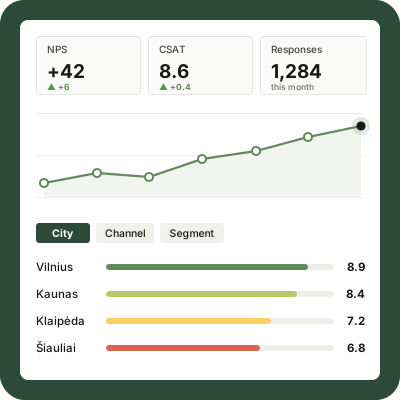
An overall customer satisfaction score can hide the differences that matter most. A poorly performing branch can disappear inside a strong company-wide average for months. The real value appears when results are analysed according to your organisational structure and customer context.
Results can be broken down by business unit, physical location, region, service type, product, customer segment, contact channel, employee team, survey distribution method, time period — and any other parameter passed through an integration.
Dashboards are designed around roles rather than a single universal template. Executives can see headline KPIs and trends, while analysts can work with detailed filters, comparisons and response distributions. Widgets can be arranged using drag-and-drop, results can be exported, and dashboards can be adjusted by your own team.
Your organisation can create and modify dashboards independently, so every new report or analytical view does not require additional development work.
Understand what customers are really saying in open-ended feedback
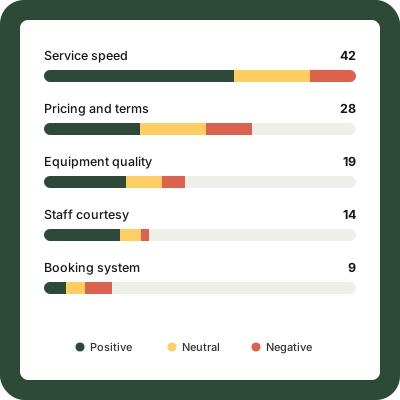
Numeric scores tell you how customers feel. Open-ended comments help explain why. The platform analyses them automatically:
- comments are grouped by themes and categories;
- positive, neutral and negative sentiment is identified;
- recurring problems are highlighted;
- changes in positive and negative feedback are tracked over time;
- comments can be filtered by category, business unit or customer segment.
Strategic categories. Open-ended feedback does not have to be analysed only through automatically detected themes. Your organisation can define the categories that matter most to the business — for example waiting time, employee behaviour, clarity of service, technical issues, pricing or process complexity — and the system can classify customer comments accordingly. This connects text analytics directly with business priorities instead of leaving you with a generic list of topics or sentiments.
Identify the strongest drivers of customer satisfaction
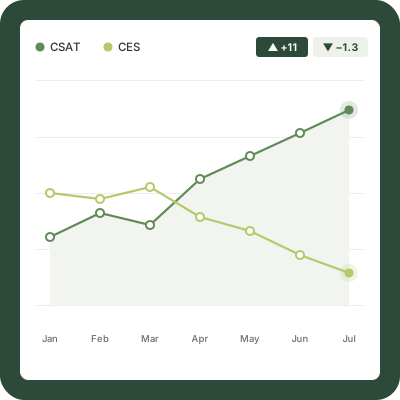
Knowing your overall CSAT or NPS is not enough. To make decisions, you need to understand which aspects of the experience are most strongly associated with satisfaction, where performance has started to decline, whether the change is temporary or systemic, and which processes should be improved first.
The platform helps by tracking trends, identifying anomalies and problem areas, analysing key drivers of satisfaction, comparing different drivers and evaluating results before and after changes are implemented.
Customer experience data is valuable only when it helps the organisation decide what to improve first.
Customer experience management use cases
Multi-location service organisation
A survey is sent after each visit, measuring CSAT and individual aspects of service. Results are compared across locations, while comments are grouped by theme. Managers can see where action is needed and which locations are performing well.
E-commerce or retail
A survey is sent after delivery to evaluate both the purchase and delivery experience. Responses can be analysed by delivery method, region or product group, helping distinguish product-related issues from logistics problems.
Customer service centre
A survey is triggered when a support case is closed, measuring both CSAT and CES. Results can be compared by team, request type or channel, making it easier to identify processes that require excessive customer effort.
Public sector organisation
Surveys are run after services, events or training sessions, with analysis by business unit, region or service type. Management receives recurring dashboards, while historical data can be imported so trends are visible from day one.
B2B relationship survey
Run periodic NPS and satisfaction surveys among key accounts. Analyse results by customer segment, service or responsible team to see how the relationship is evolving, where risk is increasing and where growth opportunities may exist.
| Feature | What it enables | Business value |
|---|---|---|
| Survey automation | Trigger surveys after specific events | Feedback is collected at the right moment |
| Email delivery infrastructure | Send unique links and track delivery | No need to build a separate sending system |
| API and integrations | Pass customer, order or branch context | Responses can be analysed using real business data |
| Custom dashboards | Create different views for different roles | Executives and analysts see what matters to them |
| Drag-and-drop editing | Modify dashboard layouts independently | Less dependence on developers |
| Open-text categorisation | Group large volumes of comments | Recurring issues become visible faster |
| Strategic categories | Analyse comments against business priorities | Feedback analytics is tied to operational goals |
| Sentiment analysis | Separate positive, neutral and negative feedback | Easier to track changes in customer sentiment |
| Trend analysis | Monitor change over time | Measure whether actions had the intended effect |
| Historical data import | Combine previous and new survey data | Preserve existing trend history |
| Data export | Send results to other systems or reports | Keep data usable across your organisation |
| Brand customisation | Adapt surveys to your brand | Create a more consistent customer experience |
More than a survey form — a complete customer experience management system
Basic survey tools are usually designed around creating a questionnaire, sending a link and viewing a general response summary. That may be enough for a one-off survey, but not for an ongoing customer experience programme. Apklausa360 is built around automated feedback collection, integrations, contextual business data, segmented analytics, custom dashboards, open-ended feedback analysis and continuous performance monitoring.
Research agencies, meanwhile, can be valuable for individual research projects, but the client typically receives a report for a specific study — and then waits for the next one. The Apklausa360 model is different. Your organisation gets a platform it can use continuously. Surveys can run periodically or automatically, data keeps accumulating, analytics remain available at any time and dashboards can be adjusted as your needs change.
Apklausa360 is designed for organisations that want customer experience measurement and analytics to become an ongoing internal capability.
How do you start a customer satisfaction programme in your organisation?
Define objectives and measurement points
Agree on what the organisation needs to understand and where in the customer journey feedback should be collected.
Select metrics and questionnaires
Choose NPS, CSAT, CES or custom metrics and create a questionnaire for each measurement point.
Prepare the data structure
Define business units, locations, channels, segments and other analytical dimensions so results can be broken down in a way that reflects how your organisation operates.
Set up channels and integrations
Configure API integrations, email delivery, QR codes, website surveys or other channels.
Build dashboards
Create tailored views for executives, business unit managers and analysts.
Launch and refine
Start collecting data, review the results and improve the measurement model based on how it is used in practice.
Day-to-day use of the platform is fully self-service — your team manages surveys, campaigns, entry points, dashboards and user access independently. If needed, we can help configure the measurement model, data structure and integrations around your organisation. Expert support is available when you need it, but it is not a requirement for using the platform.
Data protection and B2B implementation
Data hosted in Europe
Role-based access control
Data backups
Infrastructure monitoring
API authentication and secure data transfer
Contractual B2B relationship
Apklausa360 is implemented according to your organisation's requirements, with data processing conditions defined contractually. Customer data is hosted in Europe, access is managed through roles, backups are maintained and infrastructure is continuously monitored. Data exchanged between your systems and the platform is transferred through authenticated and encrypted API requests. Our team can support your organisation throughout implementation and ongoing use — from designing the initial measurement model to adjusting dashboards as requirements evolve.
Frequently asked questions
What is customer experience management?
Customer experience management is an ongoing process in which an organisation collects customer feedback at the most important points in the customer journey, analyses results by business unit, channel and customer segment, and takes actions whose impact can then be measured. Unlike a one-off survey, it works as a cycle: measurement → analysis → action → measurement again. This allows the organisation not only to understand how customers evaluate the experience, but also to see whether changes actually improve it.
How is customer experience management different from a customer satisfaction survey?
A customer satisfaction survey is typically a one-off or periodic research project that produces a snapshot of the situation at a specific moment. Customer experience management includes this type of research but goes further: data is collected continuously, analytics are available whenever needed and changes in key metrics can be tracked after each organisational action. In short, a survey answers “Where are we now?” Customer experience management also answers “Are the changes we make actually working?”
How often should customer satisfaction be measured?
It depends on the type of measurement. Transactional surveys — after purchases, service interactions or service delivery — can run continuously and automatically, with surveys triggered immediately after the event. Relationship surveys, which assess the broader customer relationship, are usually conducted quarterly or every six months. The key is to align the measurement frequency with the organisation's decision-making cycle: if results are reviewed monthly, the data should also update continuously rather than once a year.
When should NPS, CSAT and CES be used?
NPS measures loyalty and willingness to recommend, making it suitable for periodic relationship surveys. CSAT measures satisfaction with a specific service or interaction and is best used after a purchase, service interaction or consultation. CES measures the effort required from the customer and is most useful for processes such as registration, self-service and issue resolution. In practice, metrics are often combined — for example, CSAT and CES in the same post-support survey.
Can surveys be sent automatically?
Yes. Apklausa360 can trigger a survey after a specific event such as an order being delivered, a support ticket being closed, a service being completed or another action recorded in your systems. An API or SDK integration passes the event to the platform, which automatically sends the survey through the appropriate channel and links the response to relevant context such as order type, branch or customer segment. This removes manual work from both survey distribution and result collection.
Can Apklausa360 send surveys by email?
Yes. Emails can be sent through Apklausa360 infrastructure, so you do not need to build a separate sending system. Each customer receives a unique survey link, while the platform provides delivery and open statistics and shows surveys that were started but not completed. Email can also be combined with other channels such as website surveys, QR codes, POS devices or tablets — different touchpoints can use different channels.
Can results be analysed by business unit and customer segment?
Yes — this is one of the core capabilities of the platform. Results can be filtered and compared by business unit, physical location, region, service type, product, customer segment, contact channel, employee team, time period and any other parameter provided through an integration. These analytical breakdowns reveal differences that a headline average may hide — for example, one underperforming branch or delivery method pulling down the overall result.
Can historical survey data be imported?
Yes. Historical data can be imported and combined with new measurements, so analysis does not have to start from zero — trends can be visible from the first day of using the platform. This is particularly useful for organisations that have already been measuring customer satisfaction through periodic surveys or external research agencies and want to preserve that history when moving to an ongoing measurement model.
Can Apklausa360 integrate with other systems?
Yes. API and SDK integrations can pass the events that trigger surveys as well as the context used for analysis — such as customer segment, order type, branch or region. Results can also be exported to other systems and reporting environments. The scope of integration is defined during implementation based on the systems used by your organisation and the analytical dimensions you need.
How are open-ended customer comments analysed?
Comments are automatically grouped into themes, assigned positive, neutral or negative sentiment, and analysed for recurring issues. Your organisation can also define its own strategic categories — such as waiting time or employee behaviour — and the system can classify comments against those categories. Comments can then be filtered by category, business unit or customer segment, with changes in the distribution tracked over time.
How long does implementation take?
It depends on scope: the number of measurement points, integrations and the complexity of the data structure. A simple setup — one survey, one channel and standard dashboards — can be launched within a few days. A broader implementation involving API integrations, several channels and custom dashboards usually takes several weeks. During implementation, we work with your team to configure the measurement model, surveys, data structure and dashboards, so you do not need to build a separate internal project around the platform.
Where is customer data stored?
Customer data is hosted in data centres located in Europe. Access is managed through roles, backups are maintained and infrastructure is continuously monitored. Data transferred between your systems and the platform uses authenticated and encrypted API requests. Data processing conditions and responsibilities are defined in the B2B agreement according to your organisation's requirements.
Build a customer experience management model that fits your organisation
We will show you how Apklausa360 can be adapted to your customer journey, survey channels, organisational structure and analytics requirements. During the platform demo, we can discuss what you want to measure, how you currently collect customer feedback and which integrations may be required.